
Which Leg is Stronger? Using a Dual-Sided Power Meter to Investigate
This article about analyzing asymmetry between left and right legs with a dual-sided power meter is written by registered Physiotherapist, cycling coach and Cat 2 bike racer Jem Arnold.

The author, on the right, chasing. Photo by Tammy Brimner.
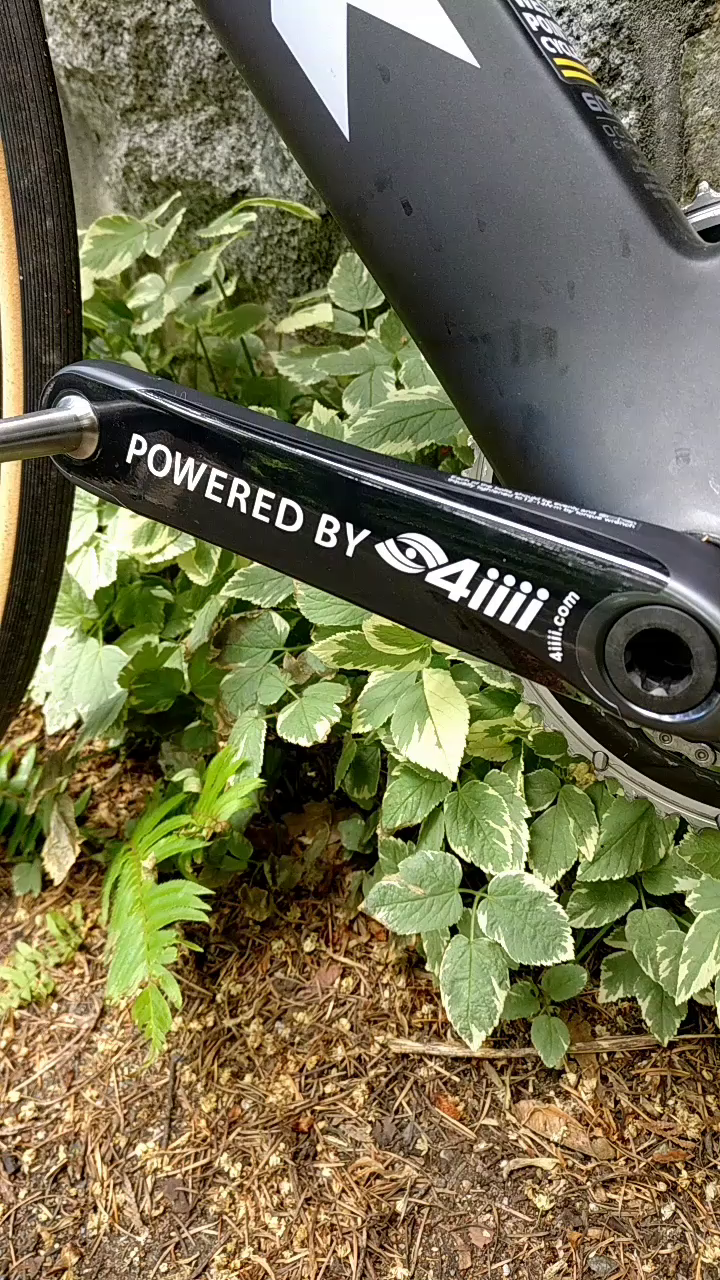
Using 4iiii Precision Pro to Investigate Left/Right Power Asymmetry
I’ve been using a 4iiii Precision Pro dual-sided power meter for the past two seasons. Having a dual-sided power meter has been critical for me, as I have a chronic injury which produces a significant Left/Right power asymmetry.
 A single-sided power meter that just doubles left leg power (my weak side) would give me unreliable data, not to mention I might never have realized I had such a severe imbalance at all.
Having a true dual-sided power meter like the 4iiii Precision Pro has allowed me to investigate the asymmetry and take steps to correct the issue through treatment and rehabilitation exercises off the bike.
This article is a summary of a more detailed investigation I published on SpareCycles.blog. The original article was not sponsored or influenced in any way by 4iiii, but I thank them for allowing me to publish this summary for their site.
L/R Power Balance
L/R balance should be 50/50 on average, but a mild asymmetry of +/- 2% either direction is nothing to worry about. If you observe a consistent imbalance greater than 2% that might warrant further investigation.
For me, my left leg begins to drop power as intensity increases past threshold, leaving my right leg to cover the difference. Let’s take a look at a stress test I did the other day that was designed to demonstrate this power imbalance at its worst.
Note, the charts below come from WKO4 Training and Analysis Software, produced by TrainingPeaks.
The first chart is a simple display of power, heart rate, and cadence for the workout.
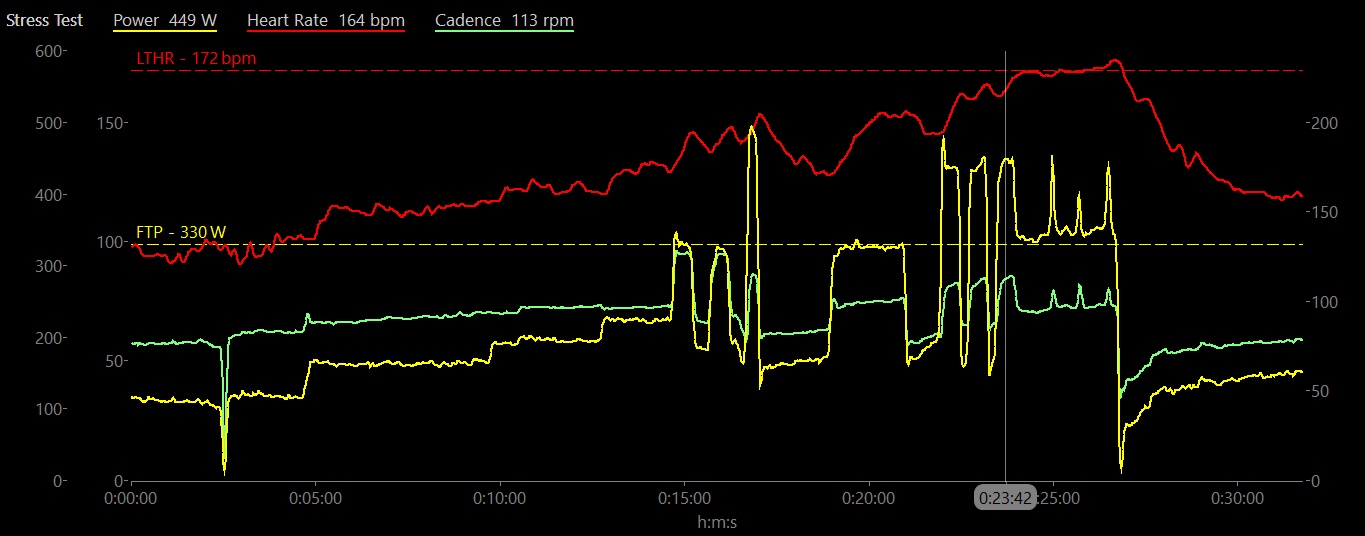
- Power is shown in yellow. The dashed yellow line is my Functional Threshold Power (FTP) which gives context for medium vs high-intensity effort.
- Heart Rate is shown in red. HR rises toward the dashed red line, which is my Lactate Threshold HR (LTHR).
- Cadence is given in green.
- The legend along the top shows power, HR, & cadence over the cursor at time 23:42.
This stress test included a ramped warm-up, some work at threshold with various cadences, and some high-intensity intervals. It appears that I hit my power targets and my HR reached threshold. All seems normal so far.
However I could feel my left leg begin to fatigue at some point during the stress test, so I know there must be something going on under the surface.
L/R Power Balance
Let’s look closer. By using the L/R balance reported by 4iiii Precision Pro power meter, we can split power into left and right legs independently.
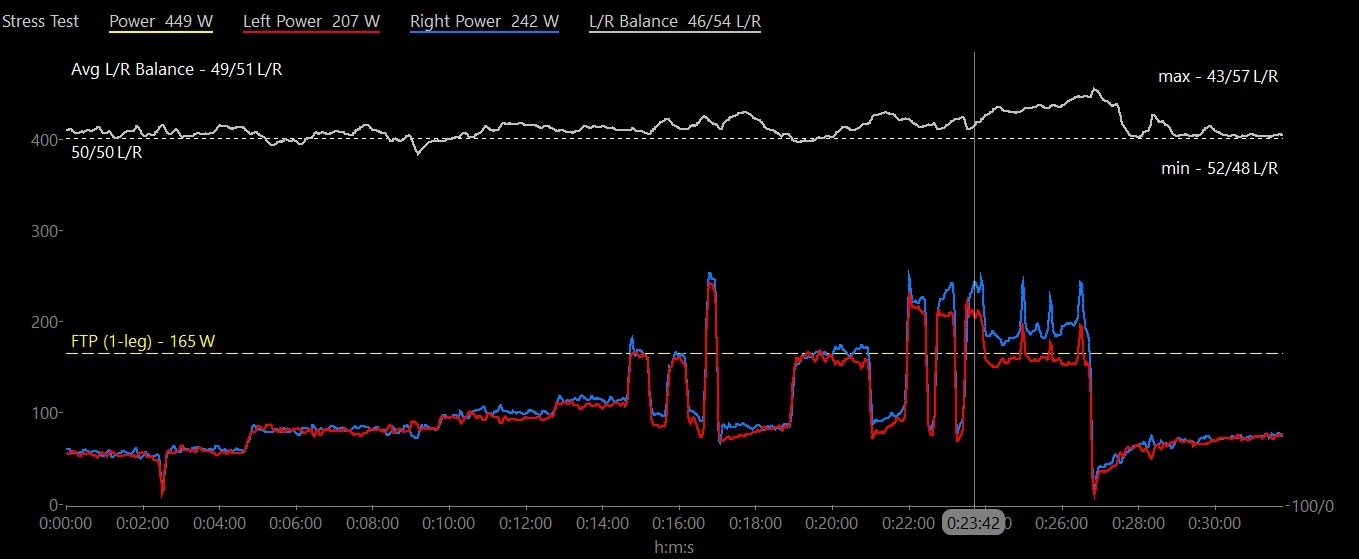
- Total power for the same point (23:42) is shown in the legend for reference.
- Single-leg FTP (FTP / 2) is the yellow dashed line on the chart.
- Left leg power is the red line.
- Right leg power in the blue line. (These numbers are what each leg is doing independently)
- L/R Balance is shown in white, smoothed to easily visualize and compared to 50/50.
- Average, min, and max L/R Balance for the workout are also given.
It’s very easy to see where my L/R power balance begins to drift away from 50/50 as the intensity rises. This corresponds very closely to the increased left leg fatigue I felt during the workout.
For example, at the cursor (23:42) my power is 449 W. This is what I would see on my power meter at this moment. However my left leg was contributing only 207 W, while my right leg was overcompensating at 242 W. By the end of the stress test, my left leg power (red line) and right leg power (blue line) were mismatched by as much as 50 W!
So my right leg had to drag along my left leg as I worked above threshold.

The author, on the left. Photo by David Gillam.
Further Investigating L/R Asymmetry
4iiii Precision Pro collects even more advanced pedaling metrics, allowing even greater insight into pedaling technique and L/R symmetry. Next time I’ll discuss how Torque Effectiveness and Pedal Smoothness can be used to investigate how each leg generates power through the pedal stroke. For a more in-depth version of the analysis in this article, head over to SpareCycles.blog.
Bonus video: Go onboard with Jem in the final lap of the Tour de Delta UCI road race in 2017, complete with power data for the final sprint:

