Friday File June 26, 2015
On this super warm Alberta day (28’ C, 80’F), we bring you some power insight and our thanks.
We can’t say enough about our terrific customers. Not only do you show us great support and patience, but you also take the time to send us your comments.
“I’m very happy with my PRECISION and will recommend it to all my friends.”
“I appreciate very much what you guys are trying to do with PRECISION and your vision for it in the market sector. I’m sure you guys are doing the best you can and I wish you great market success.”
“We understand the pain during growth. Keep on coming to market with great, innovative products.”
Thank you! These notes keep our team excited to work for you.
We will continue to use the tracker to outline our progress and reach out to customers individually when we have information re specific order timing.
And now some insight on racing with power. This past weekend, two of our crew – Emma and Karel – raced the Kicking Horse Cup in Golden B.C. The race is a true climber’s delight with a flat prologue, followed by a 13km mass start hill climb, and wrapping up with a very hilly (okay, mountainous) road race and here’s Karel’s recap:
Racing a time trial with a power meter like PRECISION is perhaps the easiest race to analyze, so we’ll focus on that. The planning for such a race starts with estimating the time required to cover the course. In this case, the prologue was 6 km long, and flat, so I estimated that I should be able finish in approximately 8 minutes (approximately 45km/hr).
Those of you already training with power will recognize the following graph as a maximal power curve. The graph shows power on the vertical axis and time on the horizontal axis. Programs like TrainingPeaks and Golden Cheetah generate and maintain these graphs throughout your training by updating the graph every time you hit a new maximum average power for a time interval on the horizontal axis. According to my power curve, the best power output I’ve managed during this season over an 8 minute interval (our time estimate) is about 345 watts.
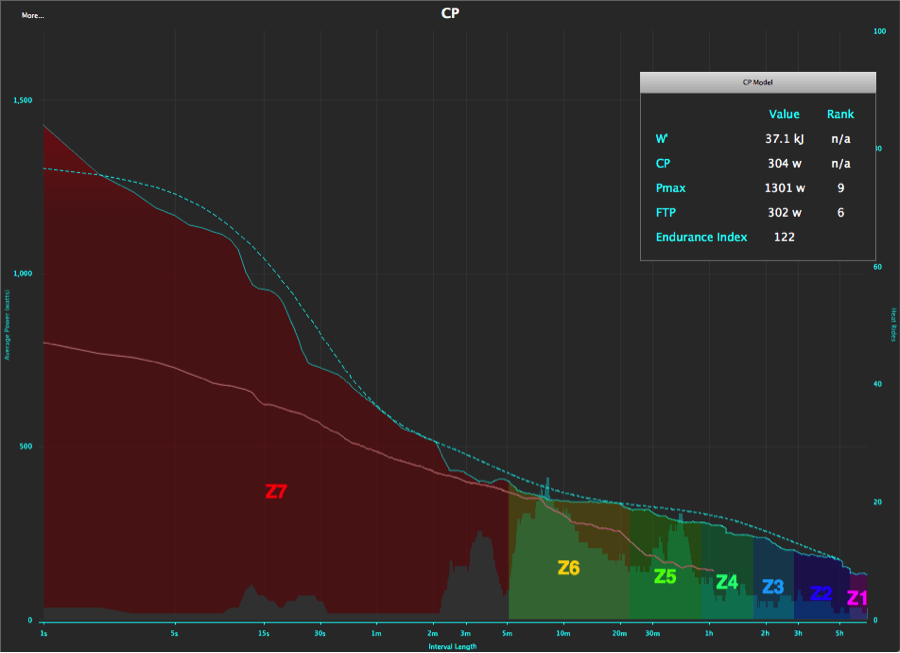
To me this indicates that if I’m well rested, if I get a good warm up in, and if I have a good day (yes a lot of ifs), then I should be able to average 345 watts during the race, and that should be my target. In order to hit that target, I use a very simple screen setup for my bike computer. All it shows is distance, 3-second average power and average power.
The pink line on my maximal power curve shows the power profile from the race. As you can see, there’s a sharp point at approximately 7:45 (the actual length of time it took to complete the race). The point comes very close to touching my maximal power curve indicating that I came just short of hitting a new best average power for that time interval, so it was a good effort.
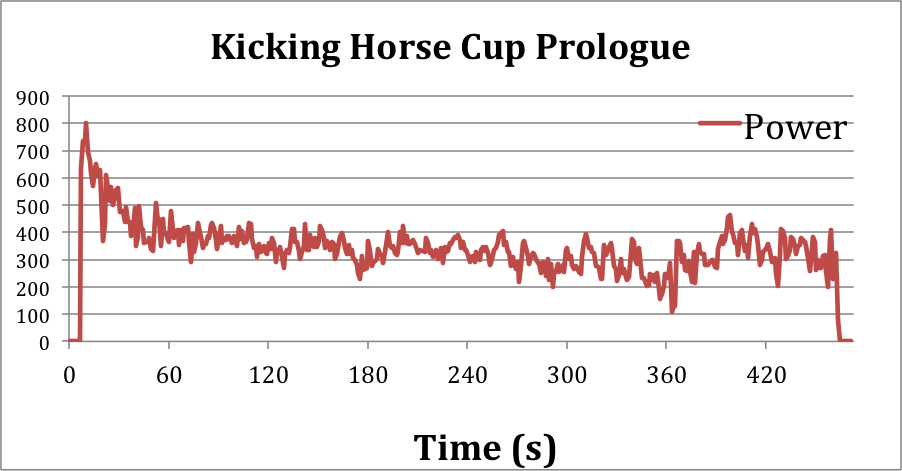
What differentiates a good effort from a great effort is pacing. Ideally, you’d want to have very steady power output for the duration of the race. This is hard to accomplish, especially in a short time trial due to adrenaline, and the fear of going out too easily, and not being able to get that time back later in the race. The graph below shows my power output during the race and you can see that I’ve made the very common error of going out too hard at the beginning and then fading towards the end. Had I had the self-control to start a little easier, I probably could have maintained that effort till the end, and been a few seconds faster.
In the end, the effort was good enough for 4th place. Our illustrious product manager, on the other hand, managed to win that race (and the others) in her category.
![]()